

A new way to look at curling analytics
I've come up with a new way of using curling analytics to rank teams of all abilities, and have created some new statistical categories to make those analytics easy to understand

A fresh look at Curling Analytics
Curling is one of the oldest sports in the world, but it’s one of the few sports in the world with very little statistical analysis.
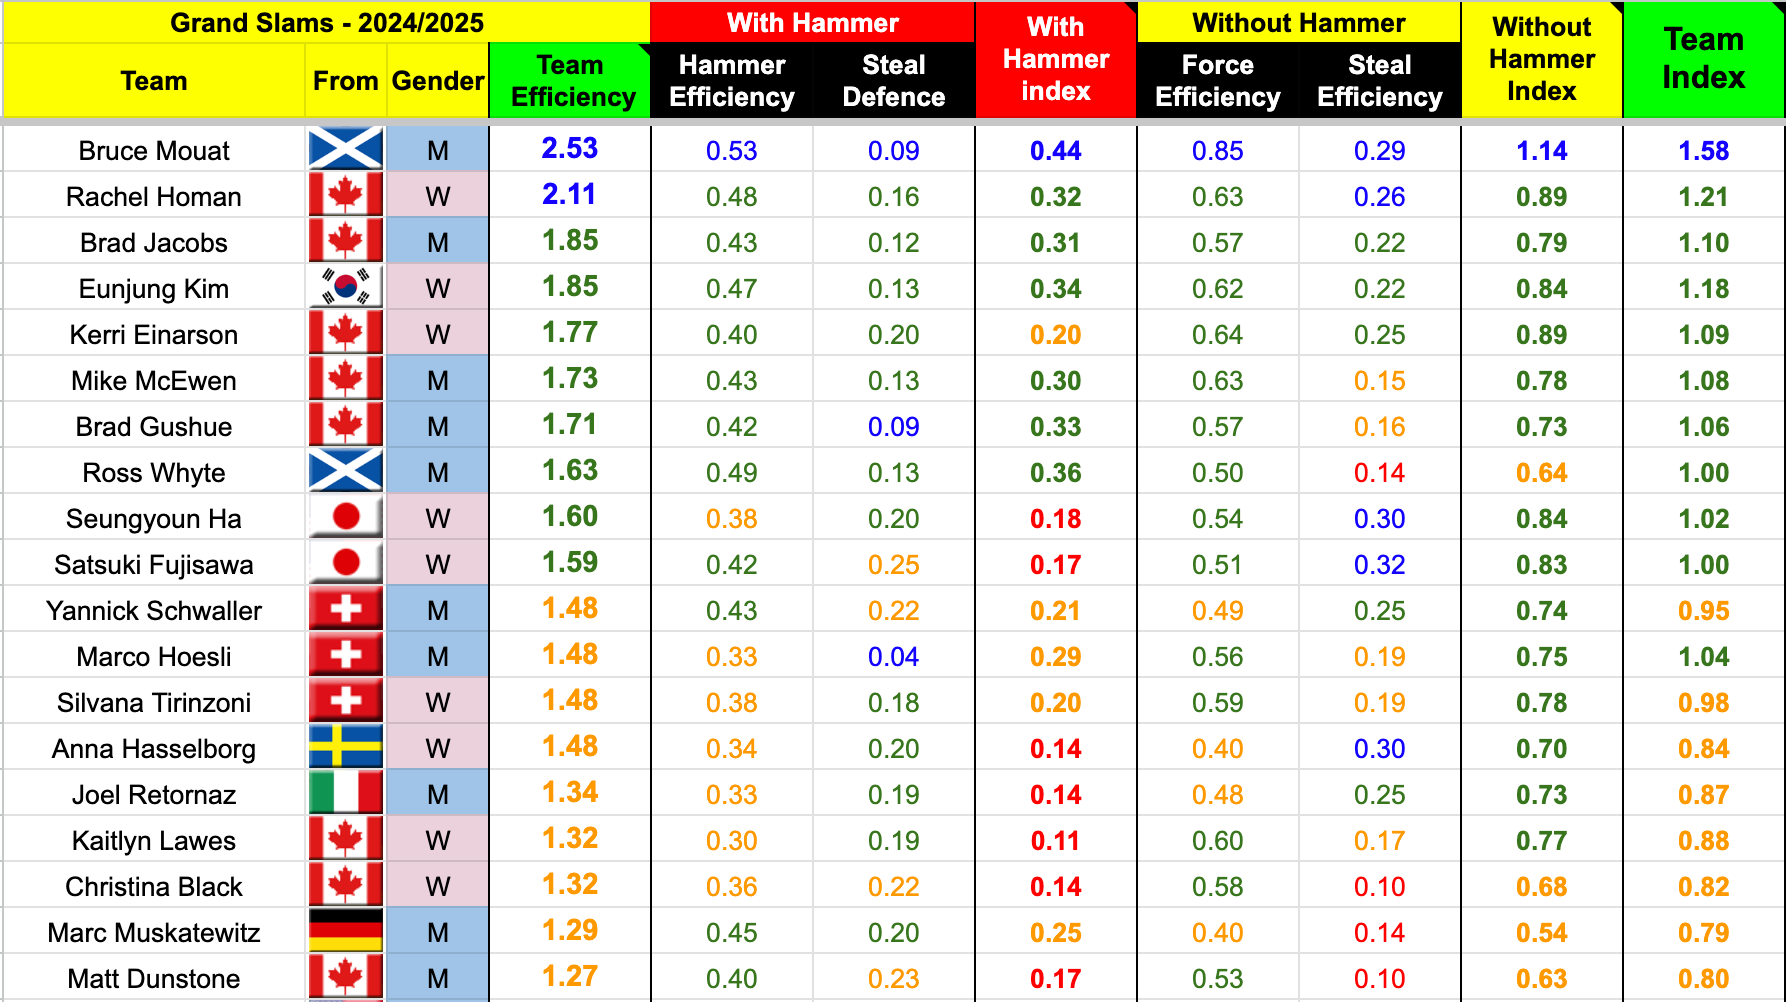
The only analytics traditionally used in curling circles are hammer efficiency, steal defence, force efficiency, and steal efficiency.
The numbers below show those analytics for a few of the top teams from the 3 Grand Slam Events I have tracked so far using my new Curling Analytics formula.

But most curlers don’t really know what they are, or how they can be used as a metric to determine the skill level of their own team, or teams they will be playing.
And information about those metrics for even the best teams in the world is almost impossible to find.
That’s where I come in. I’ve developed a new system for ranking teams based on their skills in the four categories above, and I’ve created some new Statistical Categories to make understanding those strengths and weaknesses easy to understand.
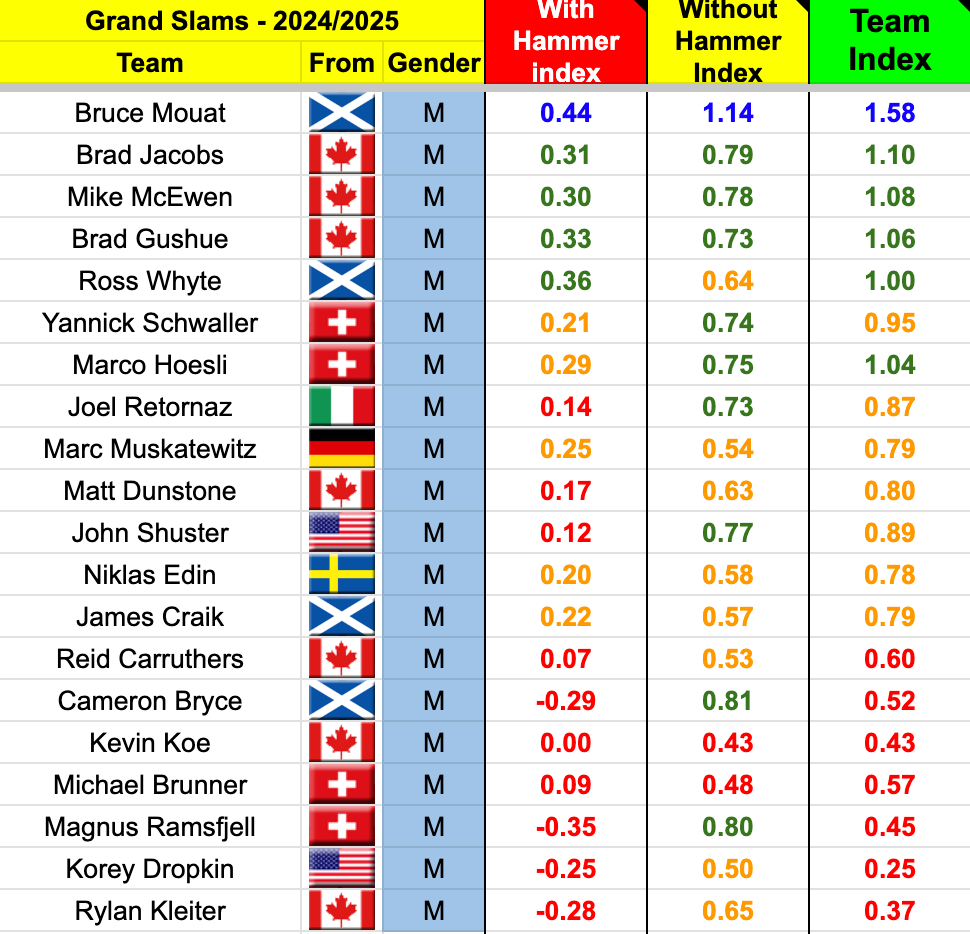
With Hammer Index
The first new number is the With Hammer Index.
It shows how strong a team’s play is when they do have the advantage of throwing the last stone of the end.
It is calculated by subtracting the team’s Steal Defence number from it’s Hammer Efficiency number to give a single number showing it’s overall strength while playing with the hammer.
Without Hammer Index
The second new number I have created is called the Without Hammer Index.
The Without Hammer Index shows how strong a team’s play is when the other team has hammer, and the advantage of throwing the last rock of the end.
It is calculated by adding a Team’s Force Efficiency, and it’s Steal Efficiency to give a single number showing it’s overall strength while playing without the hammer.

Team Index
The third new number is the Team Index.
This number shows a Team’s overall proficiency in all aspects of the game.
This number is calculated by adding the Force Efficiency, Steal Efficiency, and Hammer Efficiency numbers, and subtracting the Steal Defence number from that total to give a single number indicating the strength of a team’s overall play in all facets of the game.
Or, a simpler way - adding the With Hammer Index & the Without Hammer Index gives you the Team Index.
Team Efficiency
And the fourth new number I have created is the Team Efficiency number.
This number includes the Team Index, plus it’s Winning Percentage, because after all, there is no more important number than a Team’s Winning Percentage.
This is the number I use to rank teams for individual events, and cumulatively.
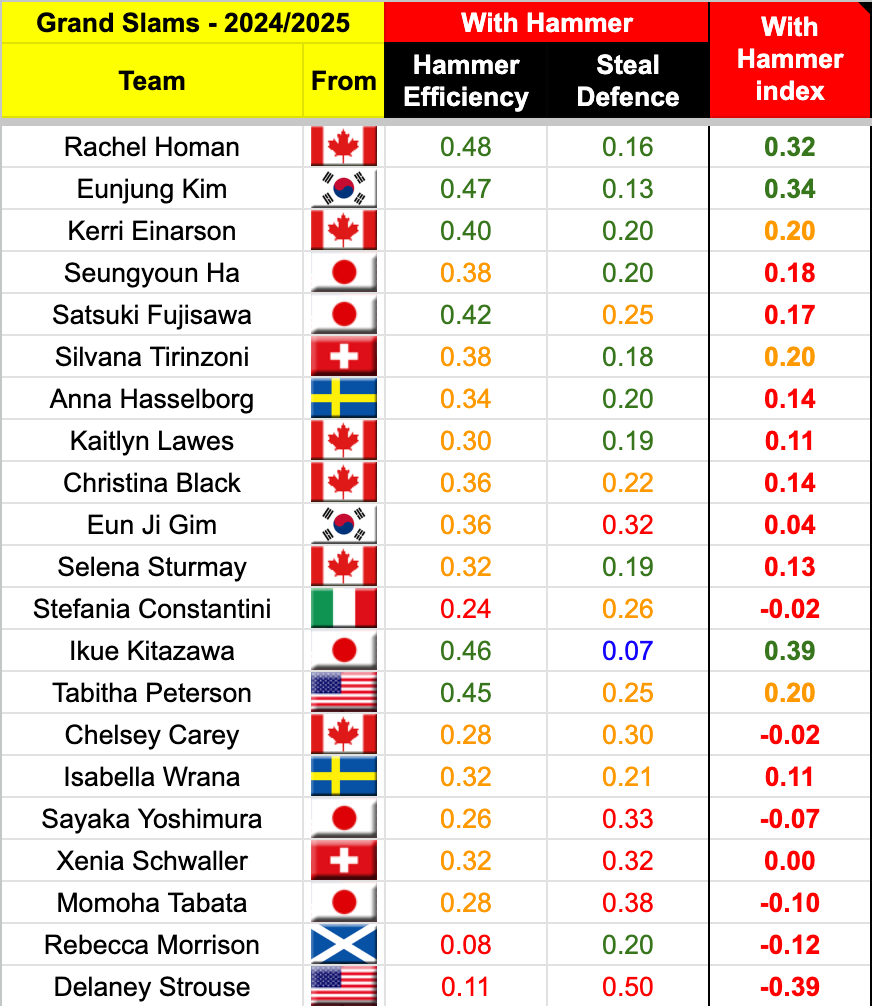
The list below shows my top ranked Women’s Teams through the first 3 Grand Slam Events of this season.

I feel like I may be on to something, but maybe I’m completely out to lunch with this. If you have any thoughts or comments, I would love to know!
If you’re a curler, I think this will be a great way to see how your team compares to the teams you are competing against. You can use it to see which areas your team might want to focus on to improve it’s performance on the ice.
You could also use it to scout out your opposition and see if they have any areas of weakness you might be able to exploit.
I’ll be tracking bonspiels from around the world as often as I can, and will be showing the numbers for the best teams in the world, and a lot of just ordinary curling teams as well.
If you’d like to see a complete list of the games and teams I have tracked so far, you can follow along by clicking on the links below - hope you’ll join me!
Men’s Teams - 2024/2025 Season
Women’s Teams - 2024/2025 Season
Grand Slams - 2024/2025 Season
Mixed Doubles - 2024/2025 Season